U.S. Hispanic Market Growing and Influential
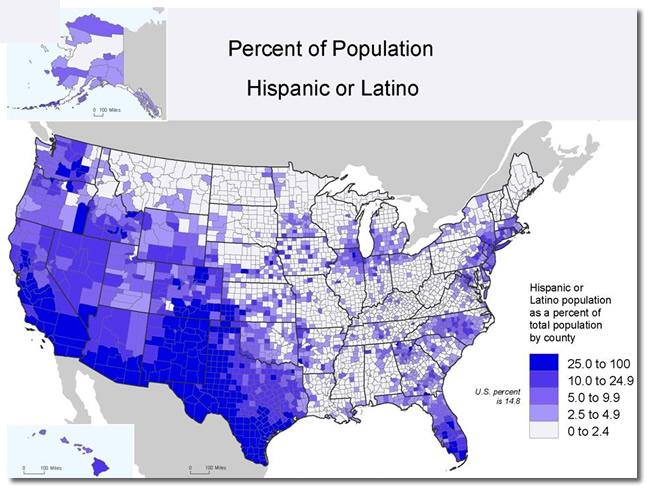
The U.S. Census counted 50.5 million Hispanics in 2010, or 16.3% of the total U.S. population, and the Hispanic population is projected to double by 2050, reaching 102.6 million. Since 2000, Hispanics have accounted for 56% of the U.S. population growth.
By 2014, 1 in every 4 mothers will be Hispanic, and 23% of all children, ages 17 and younger will be Hispanic.
As the population grows steadily, so does the influence of the market.
The current U.S. Hispanic population represented $1 trillion in purchasing power in 2010, with an estimated growth to $1.8 trillion by 2017. Hispanics accounted for 9.3% of all U.S. purchasing power in 2010, up from 6.8% in 2000, and almost three times the overall national rate during the past decade.
The U.S. Hispanic annual purchasing power of $1.8 trillion is larger than the Gross National Income of Canada ($682 billion), Spain ($588 billion), Mexico ($550 billion), or Brazil ($529 billion).
In 2010, the 10 states with the largest Hispanic markets, in order, were California ($265 billion), Texas ($176 billion), Florida ($107 billion), New York ($81 billion), Illinois ($44 billion), New Jersey ($39 billion), Arizona ($34 billion), Colorado ($22 billion), New Mexico ($20 billion) and Georgia ($17 billion).
Although their purchasing power has surged, significant differences exist in per capita income, wealth, demographics, culture, and spending habits. Hispanics represent an income level of $49,845 per household compared to $64,234 for non-Hispanic or Latino households. However, food purchases represent 15.6% of Hispanic annual expenditures or $6,486 annually, compared to a much lower 12% spent by non-Hispanic households.
Sources: U.S. Bureau of Labor Statistics, 2010 Consumer Expenditure Survey; U.S. Census Bureau; CIA World Factbook; NationMaster.